The exponential growth of artificial intelligence systems has created unprecedented demands for sophisticated log analysis and monitoring solutions that can handle massive volumes of data while providing real-time insights into system performance, behavior patterns, and potential issues. As AI applications become increasingly complex and critical to business operations, the choice between Elastic Stack and Splunk for log analysis has become a pivotal decision that can significantly impact operational efficiency, cost management, and the ability to maintain reliable AI services at scale.
Explore the latest developments in AI system monitoring to understand how cutting-edge technologies are reshaping the landscape of log analysis and system observability. The modern AI infrastructure requires monitoring solutions that can not only handle traditional application logs but also understand the unique characteristics of machine learning workloads, model training processes, and inference pipelines that generate distinctive patterns and data volumes.
Understanding the AI Logging Landscape
Modern AI systems generate an extraordinary variety and volume of log data that presents unique challenges compared to traditional application monitoring. Machine learning training processes produce detailed metrics about model convergence, gradient updates, and performance statistics across multiple epochs. Inference systems generate request logs, model prediction confidence scores, and latency measurements that require specialized analysis techniques to extract meaningful insights. Additionally, AI systems often involve complex data pipelines that process vast amounts of training data, requiring monitoring solutions that can track data lineage, transformation processes, and quality metrics throughout the entire machine learning lifecycle.
The distributed nature of AI infrastructure adds another layer of complexity to log analysis requirements. Modern AI systems typically span multiple cloud regions, utilize containerized deployments, and leverage specialized hardware such as GPUs and TPUs that generate unique performance metrics. This distributed architecture creates the need for centralized logging solutions that can aggregate data from diverse sources while maintaining the context necessary for effective troubleshooting and performance optimization.
Enhance your AI development workflow with advanced tools like Claude that can help analyze and interpret complex log patterns specific to machine learning systems. The integration of AI-powered analysis tools with traditional logging platforms creates powerful synergies that enable more sophisticated pattern recognition and automated incident response capabilities.
Elastic Stack Architecture and AI System Integration
The Elastic Stack, comprising Elasticsearch, Logstash, Kibana, and Beats, provides a comprehensive open-source solution for log collection, processing, storage, and visualization that has been specifically enhanced to address the unique requirements of AI system monitoring. Elasticsearch serves as the distributed search and analytics engine that can efficiently handle the high-volume, high-velocity data streams generated by machine learning workloads while providing near real-time search capabilities across massive datasets.
Logstash functions as the data processing pipeline that can transform and enrich log data from AI systems, applying complex parsing rules to extract structured information from unstructured log entries, correlating events across different system components, and enriching data with contextual information such as model versions, training parameters, and deployment environments. The flexibility of Logstash makes it particularly well-suited for handling the diverse data formats and sources common in AI infrastructure.
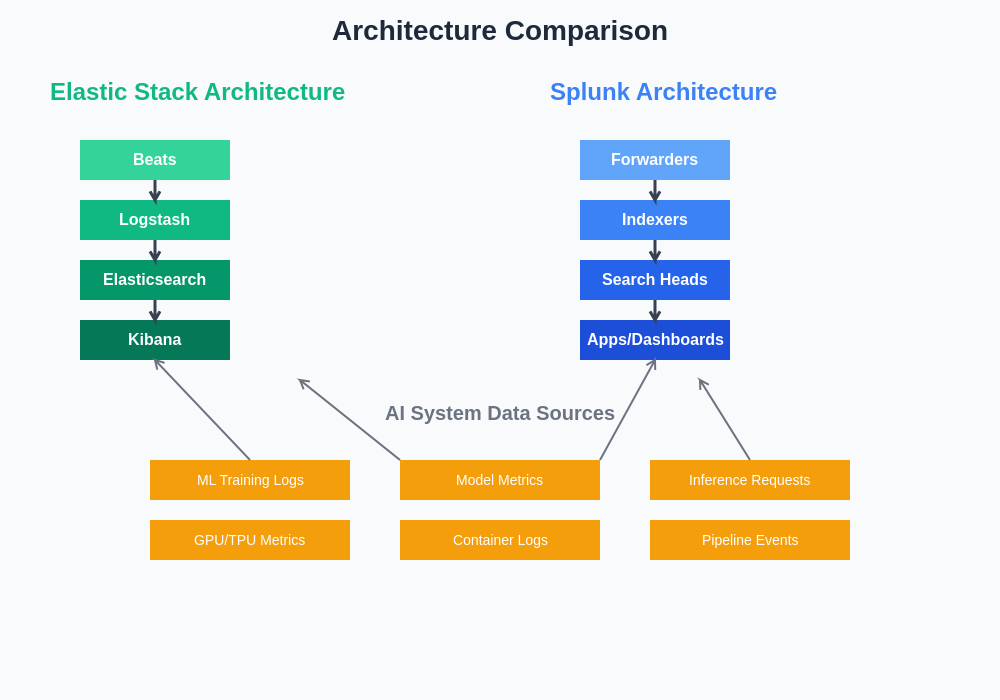
The architectural differences between these platforms fundamentally influence their performance characteristics, deployment complexity, and suitability for different AI system monitoring scenarios. Understanding these architectural distinctions is crucial for making informed decisions about platform selection.
Kibana provides the visualization and dashboard capabilities that enable data scientists, ML engineers, and operations teams to create sophisticated monitoring dashboards that track key performance indicators specific to AI systems. These dashboards can display model accuracy trends over time, resource utilization patterns during training processes, and correlation analysis between system performance and model behavior. The ability to create custom visualizations for AI-specific metrics makes Kibana an invaluable tool for understanding complex machine learning system behavior.
Splunk Platform Capabilities for Machine Learning Workloads
Splunk has evolved into a comprehensive data platform that excels at ingesting, indexing, and analyzing machine data from AI systems with particular strengths in handling unstructured data and providing powerful search capabilities across diverse log formats. The Splunk platform’s universal forwarders can collect data from virtually any source within an AI infrastructure, including container logs, application metrics, system performance data, and custom machine learning metrics generated by training and inference processes.
The Splunk Search Processing Language provides sophisticated capabilities for analyzing AI system logs, enabling complex queries that can correlate events across multiple data sources, perform statistical analysis on model performance metrics, and identify patterns that might indicate performance degradation or system anomalies. This query language has been specifically enhanced with machine learning capabilities that can automatically detect anomalies in log patterns and provide predictive insights about system behavior.
Splunk’s machine learning toolkit includes pre-built algorithms and models that can be applied directly to log data for detecting unusual patterns, forecasting system resource requirements, and identifying potential issues before they impact AI system performance. These capabilities are particularly valuable for monitoring complex machine learning pipelines where traditional rule-based alerting may not be sufficient to capture the nuanced behavioral patterns of AI workloads.
Performance and Scalability Comparison
The performance characteristics of Elastic Stack and Splunk differ significantly when applied to AI system log analysis, with each platform demonstrating distinct advantages depending on specific use case requirements and infrastructure constraints. Elastic Stack typically provides superior performance for high-volume ingestion scenarios common in AI environments, with Elasticsearch’s distributed architecture enabling horizontal scaling that can accommodate the massive log volumes generated during large-scale machine learning training operations.
Elasticsearch’s inverted index structure optimizes search performance for the types of queries commonly required in AI system monitoring, such as finding all logs related to specific model training runs, correlating performance metrics across distributed training nodes, or identifying patterns in inference request logs. The platform’s ability to handle complex aggregations and real-time analytics makes it particularly well-suited for monitoring dynamic AI workloads where performance characteristics can change rapidly based on model complexity and data characteristics.
Splunk’s performance profile tends to favor scenarios where complex data enrichment and transformation are required during the ingestion process, making it particularly effective for environments where AI system logs require extensive parsing, correlation with external data sources, or integration with existing enterprise data systems. The platform’s indexing approach provides consistent query performance across diverse data types and structures, which can be advantageous in heterogeneous AI environments where log formats may vary significantly between different system components.
Cost Considerations for AI Infrastructure
The financial implications of choosing between Elastic Stack and Splunk for AI system log analysis can be substantial, particularly given the high data volumes typically associated with machine learning workloads. Elastic Stack’s open-source foundation provides significant cost advantages for organizations with the technical expertise to deploy and maintain the platform independently, with licensing costs primarily associated with advanced features and enterprise support rather than data volume or processing capacity.
The cost structure of Elastic Stack aligns well with the variable nature of AI workloads, where log volumes may fluctuate significantly based on training schedules, model deployment cycles, and inference demand patterns. Organizations can scale their Elastic Stack infrastructure dynamically without incurring proportional licensing cost increases, making it particularly attractive for research environments or organizations with unpredictable AI workload patterns.
Splunk’s licensing model, typically based on data ingestion volume, can result in significant costs for AI systems that generate large amounts of log data, particularly during intensive training operations or high-volume inference serving. However, Splunk’s comprehensive feature set and enterprise-grade capabilities may justify these costs for organizations that require advanced analytics capabilities, extensive integration options, or comprehensive support for mission-critical AI applications.
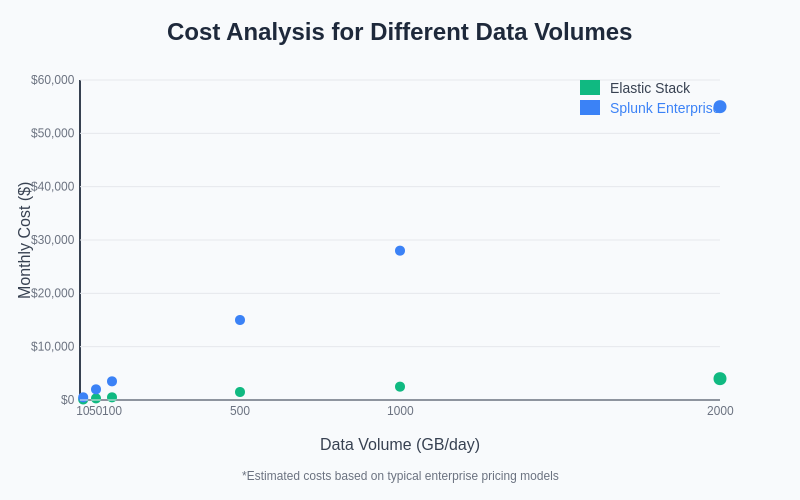
The cost implications of platform selection become increasingly significant as AI systems scale, with the choice between Elastic Stack and Splunk potentially representing substantial differences in total cost of ownership over time.
Discover comprehensive AI research capabilities with Perplexity to analyze cost-benefit scenarios and make informed decisions about logging platform selection based on specific organizational requirements and constraints.
Machine Learning and AI-Specific Features
Both platforms have developed specialized capabilities for analyzing machine learning workloads, though they approach this challenge from different perspectives and with varying degrees of sophistication. Elastic Stack has integrated machine learning capabilities directly into its core platform through the X-Pack machine learning features, which provide automated anomaly detection, forecasting, and outlier identification specifically designed for time-series data common in AI system monitoring.
The Elastic machine learning features can automatically establish baselines for normal AI system behavior, detecting deviations that might indicate model performance degradation, infrastructure issues, or data quality problems. These capabilities are particularly valuable for monitoring complex AI systems where manual rule creation would be impractical due to the dynamic and evolving nature of machine learning workloads.
Splunk’s approach to AI system monitoring emphasizes its Machine Learning Toolkit and Deep Learning Toolkit, which provide comprehensive libraries of algorithms and pre-built models that can be applied to log analysis tasks. These toolkits enable sophisticated analysis of AI system behavior, including clustering of similar log patterns, classification of system events, and predictive modeling of resource requirements based on historical patterns.
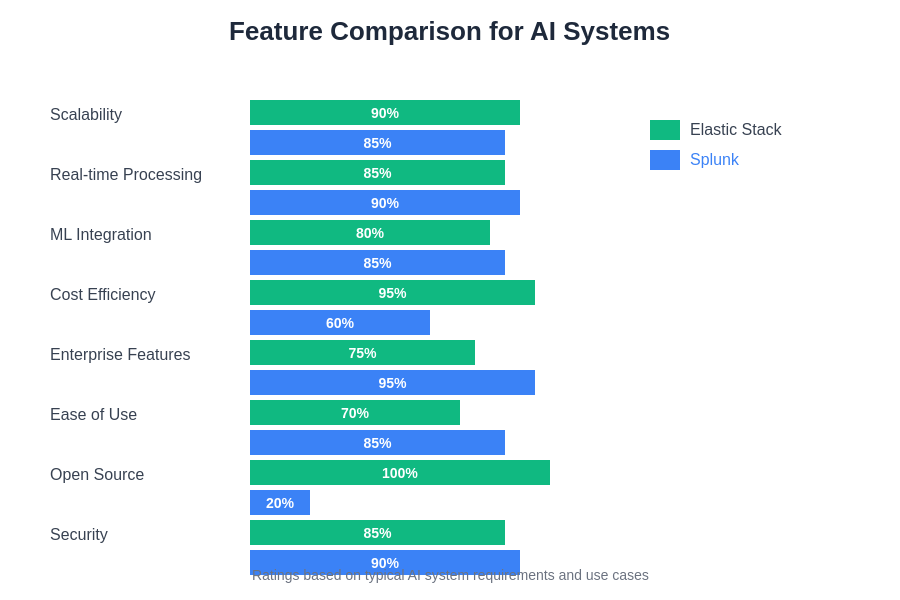
The comprehensive feature comparison reveals distinct strengths and weaknesses for each platform when applied to AI system monitoring requirements, with different capabilities proving more or less critical depending on specific organizational needs and technical constraints.
Integration with AI Development Workflows
The integration capabilities of each platform with common AI development tools and workflows represent a critical consideration for organizations seeking to establish comprehensive monitoring solutions for their machine learning infrastructure. Elastic Stack provides extensive integration options with popular AI and machine learning platforms, including native support for Kubernetes environments commonly used for AI workload orchestration, integration with MLflow for experiment tracking, and compatibility with major cloud AI services.
The Beats ecosystem within Elastic Stack includes specialized data shippers that can collect metrics from AI-specific infrastructure components such as GPU monitoring agents, container orchestration platforms, and distributed training frameworks. This comprehensive data collection capability ensures that all aspects of the AI system lifecycle can be monitored and analyzed within a unified platform.
Splunk’s integration approach emphasizes its universal data collection capabilities and extensive app ecosystem, which includes specialized applications for monitoring AI and machine learning workloads. The Splunk app for infrastructure monitoring provides out-of-the-box dashboards and alerts specifically designed for AI infrastructure components, while custom integrations can be developed to support proprietary AI platforms and tools.
Real-time Processing and Alerting Capabilities
The ability to process log data in real-time and generate timely alerts is crucial for maintaining reliable AI systems, where performance degradation or failures can have immediate impact on user experience or business operations. Elastic Stack’s architecture provides near real-time data ingestion and processing capabilities through its distributed design, enabling rapid detection of issues and automated response to system anomalies.
Kibana’s alerting framework can be configured to monitor AI-specific metrics such as model accuracy trends, inference latency patterns, and resource utilization thresholds, providing customizable notification mechanisms that can integrate with existing incident management systems. The platform’s support for complex alerting conditions enables sophisticated monitoring scenarios where multiple metrics must be correlated to determine system health status.
Splunk’s real-time processing capabilities excel in scenarios where complex event correlation and data enrichment are required before alerting decisions can be made. The platform’s ability to perform real-time analysis across multiple data streams enables sophisticated alerting scenarios where AI system behavior must be analyzed in the context of broader infrastructure performance and business metrics.
Visualization and Dashboard Capabilities
Effective visualization of AI system performance data requires specialized dashboard capabilities that can represent complex machine learning metrics in intuitive and actionable formats. Kibana provides extensive customization options for creating AI-specific dashboards, including support for time-series visualizations that can track model performance over time, heatmaps that show resource utilization across distributed training clusters, and custom metrics that combine multiple data sources to provide comprehensive system health indicators.
The ability to create interactive dashboards that enable drill-down analysis is particularly valuable for AI system monitoring, where understanding the relationship between high-level performance indicators and detailed system metrics is essential for effective troubleshooting and optimization. Kibana’s dashboard sharing and embedding capabilities enable collaboration between data science teams, operations personnel, and business stakeholders who may have different perspectives on AI system performance.
Splunk’s visualization capabilities emphasize its strength in handling complex data relationships and providing sophisticated analytical views of AI system behavior. The platform’s support for custom visualization types and advanced statistical analysis enables the creation of dashboards that can display machine learning model performance, training progress, and system health metrics in formats specifically tailored to AI workflow requirements.
Security and Compliance Considerations
AI systems often process sensitive data and operate in regulated environments where comprehensive security and compliance capabilities are essential for log analysis platforms. Elastic Stack provides robust security features through its Security plugin, including role-based access control that can be configured to restrict access to AI system logs based on user roles and organizational requirements, encryption of data both in transit and at rest, and comprehensive audit logging of all platform interactions.
The ability to implement data governance policies that ensure AI system logs are handled according to regulatory requirements is crucial for organizations operating in industries such as healthcare, financial services, or government sectors where data protection regulations may impose specific requirements on log data handling and retention.
Splunk’s enterprise security capabilities provide comprehensive coverage for AI infrastructure security monitoring, including the ability to correlate security events across AI system components, detect potential threats to machine learning infrastructure, and ensure compliance with industry-specific regulations. The platform’s support for data classification and retention policies enables organizations to implement comprehensive governance frameworks for AI system log data.
Deployment and Operational Considerations
The operational complexity and resource requirements for deploying and maintaining log analysis platforms for AI systems can vary significantly between Elastic Stack and Splunk, with important implications for ongoing operational costs and technical resource allocation. Elastic Stack’s distributed architecture requires careful planning and ongoing management of cluster resources, particularly in environments with high data volumes and complex query requirements typical of AI system monitoring.
The operational expertise required for maintaining Elastic Stack deployments includes understanding of Elasticsearch cluster management, performance tuning for high-volume ingestion scenarios, and optimization of search performance for AI-specific query patterns. Organizations must also consider the ongoing maintenance requirements for keeping pace with platform updates and security patches across the entire stack.
Splunk’s operational model typically involves less complex deployment scenarios, with the platform providing comprehensive management capabilities through its web-based interface and extensive automation features. However, the operational costs associated with Splunk deployments can be higher due to licensing requirements and the need for specialized expertise in Splunk administration and optimization.
Future Technology Trends and Platform Evolution
The rapidly evolving landscape of AI technology continues to drive innovation in log analysis platforms, with both Elastic Stack and Splunk investing significantly in capabilities that address emerging requirements for AI system monitoring and analysis. Elastic Stack’s development roadmap includes enhanced machine learning capabilities, improved integration with cloud-native AI platforms, and advanced analytics features specifically designed for modern AI workloads.
The integration of artificial intelligence into the log analysis platforms themselves represents a significant trend that promises to revolutionize how AI system monitoring is approached. Both platforms are developing AI-powered features that can automatically identify relevant log patterns, predict system behavior, and recommend optimization strategies based on historical performance data.
Cloud-native deployment models and serverless architectures are becoming increasingly important for AI system monitoring, with both platforms adapting their offerings to support these deployment patterns. The ability to provide seamless monitoring across hybrid and multi-cloud AI deployments will likely become a key differentiator as organizations adopt more distributed AI infrastructure strategies.
Making the Strategic Decision
The choice between Elastic Stack and Splunk for AI system log analysis ultimately depends on a complex combination of technical requirements, organizational constraints, cost considerations, and strategic objectives that must be carefully evaluated in the context of specific AI infrastructure and business requirements. Organizations with strong technical capabilities and cost sensitivity may find Elastic Stack’s open-source foundation and flexible deployment options more aligned with their needs, particularly if they require customization capabilities or have variable workload patterns.
Enterprises that prioritize comprehensive feature sets, extensive support options, and simplified operational management may find Splunk’s commercial platform more suitable for their requirements, despite higher licensing costs. The decision should also consider long-term strategic factors such as anticipated growth in AI workloads, evolving compliance requirements, and the organization’s overall technology strategy and vendor relationships.
The most effective approach to making this decision involves conducting thorough proof-of-concept evaluations that test both platforms against realistic AI workload scenarios, including representative data volumes, query patterns, and performance requirements. These evaluations should assess not only technical capabilities but also operational complexity, cost implications, and alignment with existing organizational processes and expertise.
Disclaimer
This article is for informational purposes only and does not constitute professional advice. The comparison presented is based on publicly available information and general platform capabilities as of the publication date. Readers should conduct their own detailed evaluation and testing based on their specific requirements, infrastructure constraints, and organizational needs. Platform capabilities and pricing models may change over time, and organizations should verify current information directly with vendors before making implementation decisions.