The deployment of artificial intelligence applications in production environments presents unique monitoring challenges that traditional observability tools often struggle to address effectively. As AI systems become increasingly sophisticated and mission-critical, the need for comprehensive monitoring solutions that can track model performance, resource utilization, and business metrics has never been more pressing. Two tools have emerged as industry standards for addressing these challenges: Prometheus, the powerful metrics collection and alerting system, and Grafana, the versatile visualization and dashboard platform that transforms raw data into actionable insights.
Stay updated with the latest AI monitoring trends and techniques to ensure your production AI systems remain performant and reliable in an ever-evolving technological landscape. The complexity of modern AI applications requires sophisticated monitoring approaches that go beyond traditional application monitoring to encompass model-specific metrics, data quality indicators, and performance characteristics unique to machine learning workloads.
Understanding the Monitoring Landscape for AI Applications
The monitoring requirements for AI applications differ significantly from traditional software systems due to the inherent complexity of machine learning models, the dynamic nature of data inputs, and the statistical characteristics of model outputs. Traditional monitoring focuses primarily on system health, response times, and error rates, while AI monitoring must additionally track model accuracy, data drift, prediction confidence, feature importance, and countless other metrics specific to machine learning workflows.
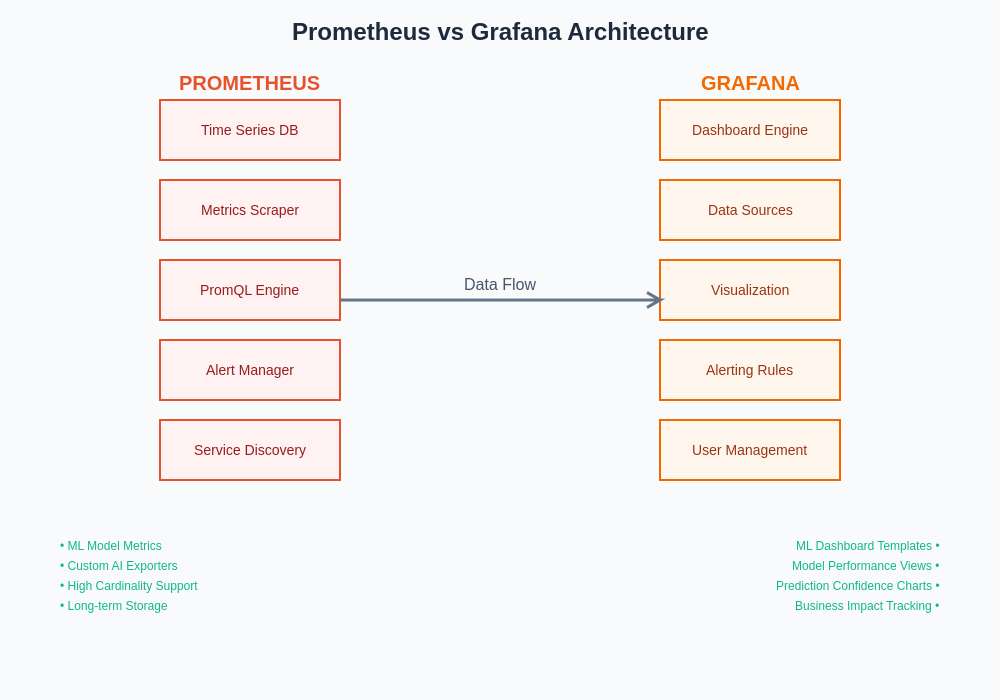
Prometheus and Grafana have evolved to meet these specialized requirements through their flexible architectures and extensive customization capabilities. Prometheus excels at collecting and storing time-series metrics from diverse sources, making it ideal for tracking the multifaceted performance characteristics of AI systems. Its pull-based architecture and powerful query language enable sophisticated analysis of model behavior over time, while its alerting capabilities ensure that degradation in model performance or system health is detected promptly.
Grafana complements Prometheus by providing rich visualization capabilities that transform complex metrics into intuitive dashboards and reports. The ability to create custom visualizations specifically designed for machine learning metrics has made Grafana indispensable for AI operations teams who need to monitor model performance, track business impact, and communicate system status to stakeholders across technical and non-technical audiences.
Prometheus: The Foundation of AI Metrics Collection
Prometheus serves as the cornerstone of modern AI monitoring infrastructure through its robust metrics collection capabilities and time-series database architecture. The system’s design philosophy emphasizes reliability, scalability, and simplicity, making it particularly well-suited for the demanding requirements of production AI environments where consistent data collection is critical for maintaining model performance and system reliability.
The pull-based architecture of Prometheus provides significant advantages for AI monitoring scenarios where services may be distributed across multiple environments, cloud platforms, or edge computing locations. This approach ensures that metrics collection remains consistent even when network connectivity is intermittent or when AI services are dynamically scaled based on workload demands. The system’s ability to automatically discover and monitor new services makes it particularly valuable in containerized AI environments where model serving instances may be frequently created and destroyed.
Prometheus’s query language, PromQL, offers sophisticated capabilities for analyzing AI-specific metrics that go far beyond simple aggregations and averages. Data scientists and ML engineers can construct complex queries to analyze model performance trends, detect anomalies in prediction patterns, and correlate system performance with business outcomes. The language’s support for mathematical operations, statistical functions, and time-based analysis makes it possible to implement sophisticated monitoring logic directly within the metrics system.
Enhance your AI monitoring capabilities with Claude’s advanced analytics to gain deeper insights into model performance and system behavior through intelligent data analysis and automated anomaly detection. The integration of AI-powered analysis tools with traditional monitoring platforms creates opportunities for more proactive and intelligent monitoring approaches that can predict issues before they impact production systems.
Grafana: Transforming AI Metrics into Actionable Insights
While Prometheus excels at metrics collection and storage, Grafana transforms this raw data into compelling visualizations that enable teams to understand complex AI system behavior at a glance. The platform’s strength lies in its ability to create custom dashboards specifically tailored to the unique visualization needs of machine learning operations, from model performance tracking to resource utilization analysis and business impact measurement.
Grafana’s extensive plugin ecosystem provides specialized visualization options that are particularly valuable for AI monitoring use cases. Heat maps can display model prediction distributions over time, allowing teams to identify shifts in model behavior that might indicate data drift or model degradation. Custom panels can visualize confusion matrices, ROC curves, and other machine learning-specific metrics in real-time, providing immediate feedback on model performance changes.
The platform’s alerting capabilities extend beyond simple threshold-based notifications to include complex condition detection that can identify subtle patterns in AI system behavior. Teams can configure alerts based on combinations of metrics, trend analysis, and statistical anomalies that are specific to their machine learning workflows. This sophisticated alerting approach helps prevent false positives while ensuring that genuine issues are detected quickly and addressed before they impact business operations.
Architecture Considerations for AI Monitoring
The architectural decisions surrounding Prometheus and Grafana deployment significantly impact the effectiveness of AI monitoring systems. Production AI environments often involve complex distributed architectures that span multiple cloud regions, edge computing locations, and hybrid infrastructure configurations. The monitoring architecture must be designed to handle these complexities while maintaining consistent performance and reliability.
Prometheus federation capabilities enable hierarchical monitoring architectures that can aggregate metrics from multiple sources while maintaining local monitoring capabilities at each level. This approach is particularly valuable for AI applications that process data at edge locations but need centralized monitoring and analysis capabilities. Local Prometheus instances can collect detailed metrics from edge AI services, while federated configurations aggregate key metrics for global visibility and analysis.
High availability configurations become critical for AI monitoring systems because model performance degradation or system failures can have immediate business impact. Prometheus clustering and Grafana high availability setups ensure that monitoring capabilities remain operational even during infrastructure failures, providing continuous visibility into AI system performance when it’s needed most.
The architectural choices between Prometheus and Grafana implementations significantly impact monitoring effectiveness, scalability, and operational complexity. Understanding these architectural patterns enables teams to design monitoring systems that meet their specific requirements while maintaining flexibility for future growth and evolution.
Metrics Strategy for Machine Learning Models
Developing an effective metrics strategy for AI applications requires careful consideration of both technical performance indicators and business impact measurements. The metrics collection approach must balance comprehensiveness with performance impact, ensuring that monitoring activities don’t negatively affect the AI services being monitored while still providing sufficient visibility into system behavior.
Model-specific metrics form the foundation of AI monitoring strategies and include accuracy measurements, prediction confidence scores, feature importance tracking, and performance benchmarks specific to the machine learning algorithms in use. These metrics must be collected consistently across different model versions and deployment environments to enable meaningful comparisons and trend analysis over time.
Data quality metrics represent another critical category that encompasses input data validation, feature distribution monitoring, and data drift detection. These metrics help identify when changes in input data characteristics might be affecting model performance, enabling proactive responses to data quality issues before they result in degraded predictions or business impact.
Business impact metrics connect AI system performance to organizational objectives by tracking metrics such as conversion rates, user satisfaction scores, revenue impact, and operational efficiency improvements. These metrics demonstrate the value of AI investments while providing early warning indicators when AI system issues begin affecting business outcomes.
Performance Optimization and Scalability
The performance characteristics of Prometheus and Grafana in AI monitoring environments require careful optimization to handle the high-volume, high-cardinality metrics typical of machine learning workloads. AI applications often generate significantly more metrics than traditional applications due to the need to monitor multiple model variants, track detailed performance statistics, and maintain historical data for trend analysis and model comparison.
Prometheus storage optimization becomes critical when dealing with the large volumes of time-series data generated by AI monitoring systems. Techniques such as metric retention policies, data compression, and strategic use of recording rules help manage storage requirements while maintaining query performance. The configuration of scrape intervals and metric retention periods must balance monitoring granularity with resource consumption to ensure sustainable operations.
Grafana dashboard performance optimization focuses on query efficiency and visualization responsiveness when dealing with large datasets typical of AI monitoring scenarios. Template variables, query caching, and strategic use of aggregation functions help maintain dashboard responsiveness while providing the detailed visibility required for effective AI monitoring.
Leverage Perplexity’s research capabilities to stay current with emerging monitoring techniques and optimization strategies that can enhance your AI monitoring infrastructure’s performance and effectiveness. The rapidly evolving landscape of AI monitoring requires continuous learning and adaptation to maintain optimal monitoring capabilities.
Alert Management for AI Systems
Alerting strategies for AI applications must account for the probabilistic nature of machine learning models and the complex interdependencies between different system components. Traditional alerting approaches based on simple thresholds often generate excessive false positives in AI environments where normal system behavior includes significant variability and statistical fluctuations.
Sophisticated alerting strategies leverage statistical analysis to establish dynamic thresholds that adapt to normal variations in AI system behavior while still detecting genuine anomalies and performance degradation. These approaches use historical data analysis, seasonal adjustments, and confidence intervals to create more intelligent alerting conditions that reduce alert fatigue while maintaining sensitivity to important issues.
Multi-criteria alerting configurations combine multiple metrics and conditions to create more reliable alert triggers that account for the complex relationships between different aspects of AI system performance. These configurations help distinguish between temporary fluctuations and sustained performance issues that require immediate attention and intervention.
Data Visualization Best Practices
Effective visualization of AI monitoring data requires specialized approaches that can communicate complex statistical information clearly while enabling rapid identification of issues and trends. The unique characteristics of machine learning metrics demand visualization strategies that go beyond traditional system monitoring dashboards to include specialized charts, statistical displays, and predictive visualizations.
Dashboard design for AI monitoring emphasizes the hierarchical presentation of information, starting with high-level system health indicators and providing drill-down capabilities to detailed performance metrics and diagnostic information. This approach enables different stakeholders to access information at the appropriate level of detail for their roles and responsibilities.
Real-time visualization capabilities enable immediate response to AI system issues by providing live updates on model performance, system health, and business impact metrics. These capabilities are particularly important for AI applications that operate in time-sensitive environments where rapid response to performance degradation is critical for maintaining service quality and business outcomes.
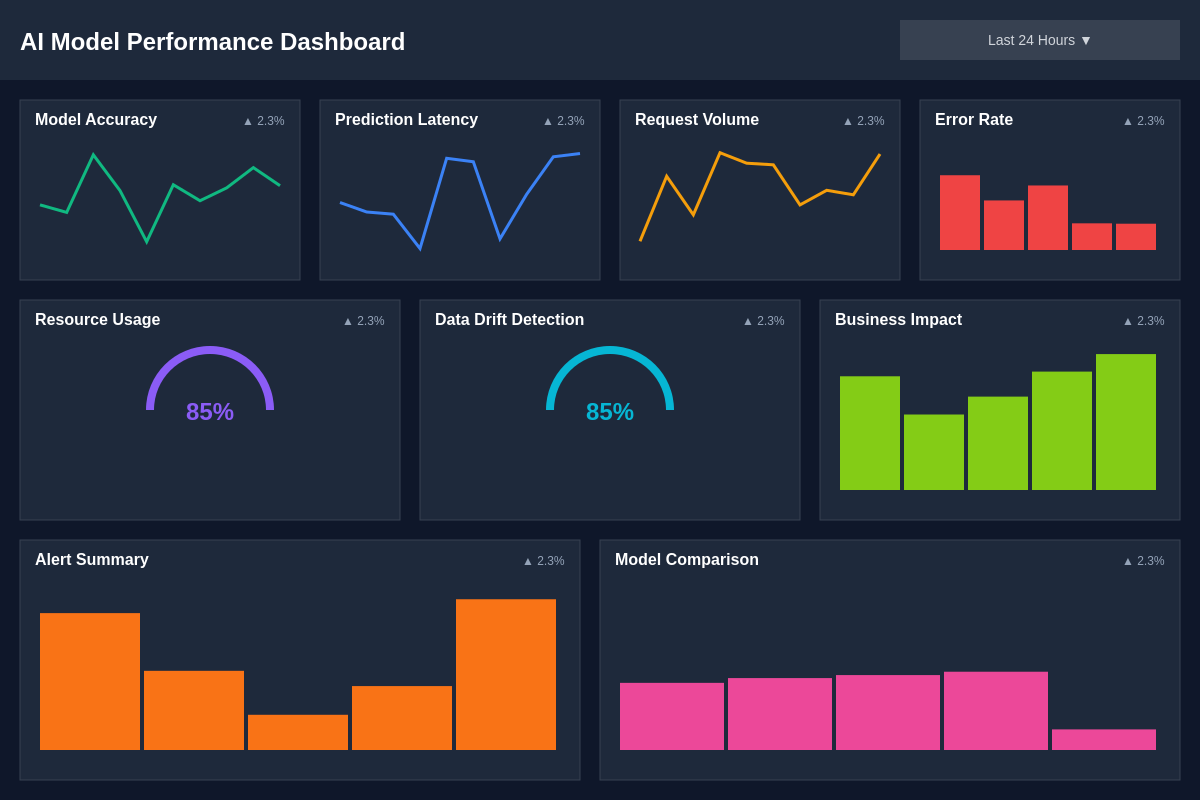
The design of effective AI monitoring dashboards requires careful consideration of information hierarchy, visual clarity, and user workflow patterns. These dashboard design principles ensure that monitoring information is accessible and actionable for different stakeholders while maintaining the comprehensive coverage necessary for effective AI operations.
Integration Strategies and Ecosystem Considerations
The integration of Prometheus and Grafana with existing AI development and deployment toolchains requires careful planning to ensure seamless data flow and operational efficiency. Modern AI environments often include multiple tools for model development, training, deployment, and management, each potentially generating valuable monitoring data that should be incorporated into the overall observability strategy.
Container orchestration platforms such as Kubernetes provide natural integration points for Prometheus and Grafana through their extensive monitoring capabilities and service discovery mechanisms. These platforms enable automatic monitoring configuration for AI workloads while providing the scalability and reliability required for production AI deployments.
Cloud platform integrations extend monitoring capabilities to include managed AI services, serverless computing platforms, and specialized AI infrastructure components. These integrations ensure comprehensive visibility across hybrid and multi-cloud AI deployments while leveraging platform-specific monitoring capabilities and optimizations.
Security and Compliance Considerations
Security and compliance requirements for AI monitoring systems often exceed those of traditional monitoring implementations due to the sensitive nature of data processed by AI applications and the regulatory requirements surrounding AI system operations. Monitoring systems must be designed to protect sensitive information while providing the transparency and auditability required for compliance with data protection regulations and industry standards.
Access control mechanisms ensure that monitoring data is available to authorized personnel while preventing unauthorized access to sensitive performance information or system details. Role-based access controls enable fine-grained permissions that align with organizational responsibilities and compliance requirements.
Data retention and privacy policies must address the long-term storage of monitoring data while complying with data protection regulations and organizational policies. These policies must balance the need for historical data analysis with privacy requirements and storage cost considerations.
Cost Management and Resource Optimization
The cost implications of comprehensive AI monitoring can be significant, particularly in cloud environments where monitoring data storage and query processing contribute to operational expenses. Effective cost management strategies balance monitoring comprehensiveness with resource consumption to ensure sustainable monitoring operations that provide value commensurate with their cost.
Resource optimization techniques focus on efficient data collection, storage, and processing strategies that minimize infrastructure requirements while maintaining monitoring effectiveness. These techniques include strategic metric selection, data aggregation strategies, and intelligent retention policies that preserve important historical data while managing storage costs.
Monitoring ROI analysis helps organizations evaluate the value provided by their monitoring investments by correlating monitoring capabilities with business outcomes, operational efficiency improvements, and issue prevention benefits. This analysis guides decision-making around monitoring scope and resource allocation to ensure optimal investment in monitoring capabilities.
Future Trends and Evolution
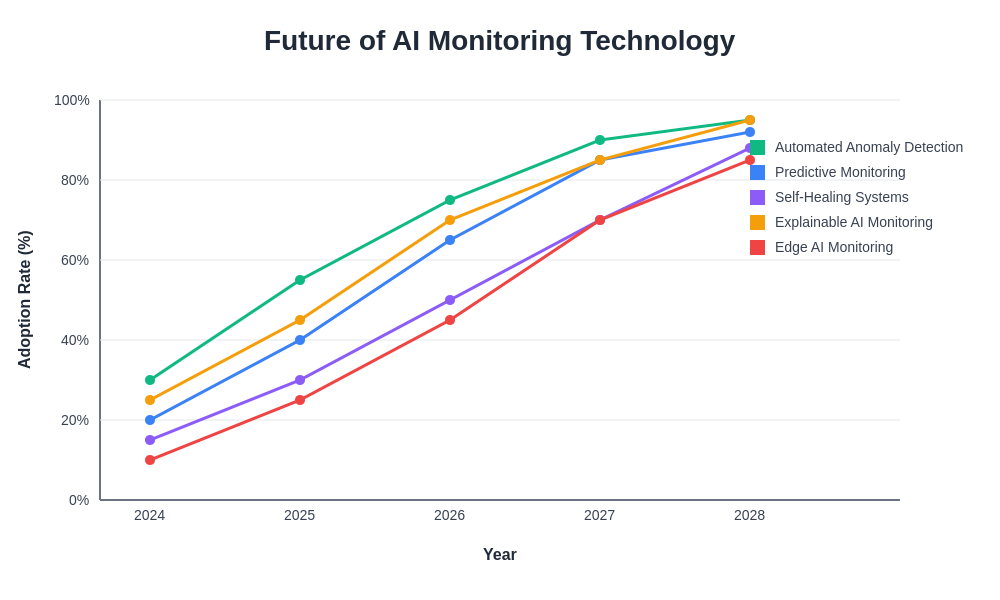
The evolution of AI monitoring continues to accelerate as machine learning technologies become more sophisticated and deployment patterns become more complex. Emerging trends in AI monitoring include the integration of artificial intelligence into monitoring systems themselves, creating intelligent monitoring capabilities that can automatically detect anomalies, predict issues, and recommend optimization strategies.
Advanced analytics capabilities are being integrated into monitoring platforms to provide deeper insights into AI system behavior and performance patterns. These capabilities include automated root cause analysis, predictive maintenance recommendations, and intelligent alerting that reduces false positives while improving issue detection accuracy.
The convergence of monitoring, observability, and AI operations tooling creates opportunities for more integrated and intelligent approaches to AI system management. This convergence enables monitoring systems to contribute more directly to AI system optimization and maintenance activities while providing better integration with development and deployment workflows.
The technological evolution of AI monitoring platforms continues to expand capabilities while improving ease of use and operational efficiency. These developments promise to make comprehensive AI monitoring more accessible and effective while addressing the growing complexity of production AI systems.
Conclusion and Strategic Recommendations
The choice between Prometheus and Grafana for AI monitoring is not typically an either-or decision, but rather a strategic integration that leverages the strengths of both platforms to create comprehensive monitoring solutions. Prometheus provides the robust metrics collection and storage capabilities essential for reliable AI monitoring, while Grafana delivers the visualization and dashboarding capabilities necessary for transforming monitoring data into actionable insights.
Organizations implementing AI monitoring solutions should focus on developing comprehensive metrics strategies that address both technical and business requirements while ensuring scalability and cost-effectiveness. The monitoring architecture should be designed to evolve with changing AI system requirements while maintaining operational stability and reliability.
The investment in sophisticated AI monitoring capabilities pays dividends through improved system reliability, faster issue resolution, better resource utilization, and enhanced business outcomes from AI applications. As AI systems become more critical to business operations, the importance of effective monitoring will continue to grow, making the strategic implementation of tools like Prometheus and Grafana essential for successful AI operations.
Disclaimer
This article is for informational purposes only and does not constitute professional advice. The views expressed are based on current understanding of monitoring technologies and their applications in AI environments. Organizations should conduct thorough evaluations of their specific requirements and constraints when selecting and implementing monitoring solutions. The effectiveness of monitoring strategies may vary depending on specific use cases, infrastructure configurations, and organizational requirements.